Water Footprint
In 2002 Arjen Hoekstra of UNESCO-IHE* suggested Rees’ ecological footprint concept be applied to water use. Water use had traditionally been measured by the amount of water “used” by consumers. But Hoekstra argued that water withdrawals from aquifers, lakes, and rivers did not capture a holistic picture of water use.
Professor Hoekstra proposed water use be seen through three lenses. Blue water would refer to water drawn from aquifers, lakes, and rivers for irrigation. Green water would refer to rainwater. Grey water would be the water required to dilute pollutants so processed water could again meet water quality standards.
Over the next several years, the methodology for computing water footprint was developed, marked by the 2004 report “Water Footprint of Nations” and the 2008 book “Globalization of Water.” The 2009 “Water Footprint Manual” established a global standard for calculating water footprint.
Hoekstra and his colleagues published papers in 2011 and 2012 documenting the water footprint of major animal and crop products. This research has led to a startling insight: 93% of global fresh water use by humans goes to agriculture. This is contrary to the traditional estimate of 70%.
Hoekstra’s research led the UN to dedicate World Water Day 2012 to the theme “Water and Food Security.” An individual may or may not drink the recommended 12 cups of water per day. But even in the most water-wise and food-conscious countries, the food that person eats will require thousands of cups of water per day to grow and feed. In my own United States, the required daily water exceeds 1000 gallons per day.
Hoekstra’s numbers are calculated at the national level, and in terms of cubic meters per metric ton of product. While this is excellent information to understand current use, it is not information that most individuals can use to inform their personal choices.
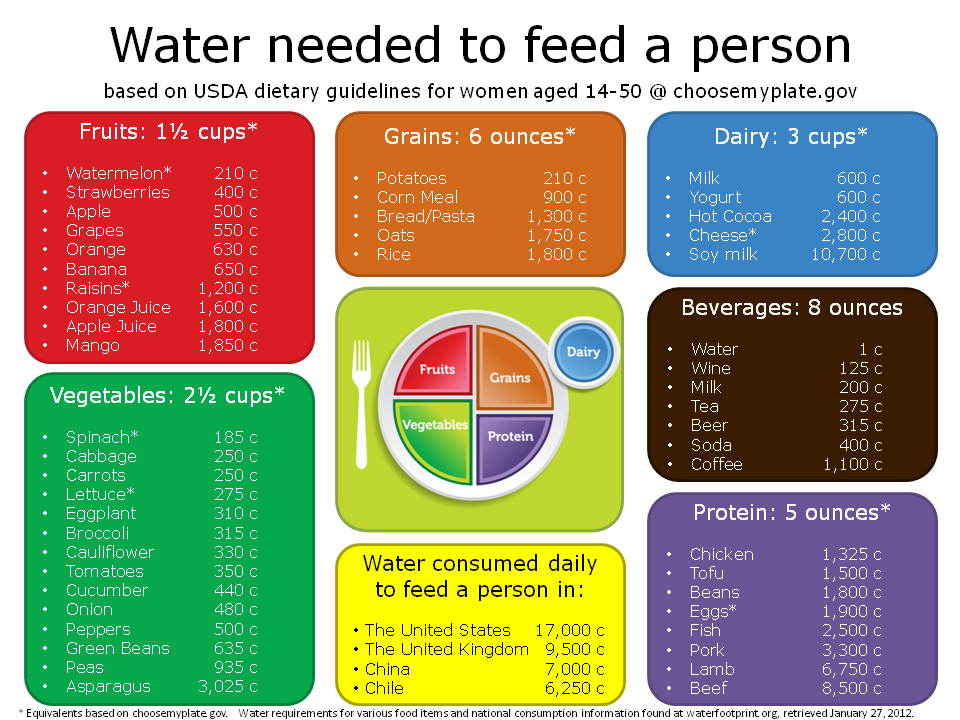
In March 2012 I created a chart to illustrate the water required to fulfill the USDA recommended food intake if an individual ate any of a variety of animal and crop products.
I’ve gone back to spot-check my math, and so far I have noted one error. Turns out it takes 600 cups of water to produce a single cup of milk, so the daily recommended 3 cups of milk would require 1800 cups of water, not the 600 I listed in my original chart.
Back in the day, William Rees was able to massively reduce the footprint of his computer by turning it on its side. I suggest that it’s possible for the average American to similarly reduce their daily “water footprint,” by making minor modifications to their normal food choices.
*UNESCO-IHE is the United Nations Educational, Scientific and Cultural Organization International Institute for Hydraulic and Environmental Engineering


June 27th, 2012 at 7:43 pm
Interesting. I’d love to go over these foods in terms of relative nutrition. It seems you pointed out soy was worse than some meat, did that measure by grams of protein? Dairy sources, for instance, would be weighed by their calcium content, fruit by antioxidant content, and so forth.